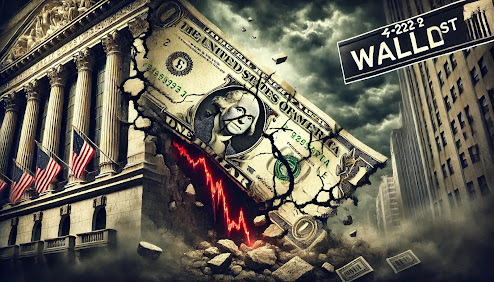
Market Volatility Amid Rising Tensions in the Strait of Hormuz

Introduction
The Strait of Hormuz, a narrow 21-mile-wide waterway connecting the Persian Gulf to the Gulf of Oman, is the world’s most critical oil chokepoint. Each day, approximately 20 million barrels of crude oil and petroleum products pass through this strategic corridor—representing roughly 20% of global oil consumption. When geopolitical tensions flare in this region, the entire global energy market feels the shockwaves. In recent weeks, escalating rhetoric and military posturing between Iran, the United States, and allied nations have reignited fears of a potential closure or significant disruption to shipping lanes. This blog post examines the current state of market volatility, analyzes the historical and emerging drivers of risk, and provides practical insights for traders, investors, and policy makers navigating this unstable landscape.
From the immediate spike in crude prices to the ripple effects across equities, currencies, and commodities, the Strait of Hormuz remains a lynchpin for global economic stability. Understanding the dynamics at play—and preparing for multiple scenarios—is essential for anyone with exposure to energy markets. Let's dive into the key factors fueling volatility, the likely impacts on crude and broader markets, and actionable strategies to manage risk.
The Geopolitical Powder Keg: Why the Strait of Hormuz Matters
Strategic Importance of the Waterway
The Strait of Hormuz is not just a geographic feature; it is a geopolitical lever. For decades, Iran has threatened to close the strait in response to sanctions, military pressure, or diplomatic isolation. While a complete blockade is a worst-case scenario, even partial disruptions can cause panic buying, supply chain delays, and price spikes. Key facts underscore its significance:
- Transit volume: Roughly 17-20 million barrels per day (bpd) of crude and refined products flow through the strait.
- Major exporters: Saudi Arabia, Iraq, Kuwait, the UAE, and Iran rely on this route for their exports.
- Global impact: A prolonged closure could cut global oil supply by 20%, sending prices to levels not seen since the 2008 financial crisis.
The Current Flashpoints: Iran, War Rhetoric, and Proxy Actions
Tensions have escalated due to several interconnected factors:
- Iran’s nuclear program: Recent advances in enrichment have triggered new rounds of sanctions and threats of military action.
- U.S. naval deployments: The dispatch of aircraft carriers and submarines to the region signals a readiness to protect freedom of navigation.
- Houthi attacks in the Red Sea: Iran-backed groups have targeted commercial vessels, disrupting alternative shipping routes and raising the cost of maritime insurance.
- Diplomatic breakdown: Failed negotiations over the JCPOA (Joint Comprehensive Plan of Action) have left a vacuum, increasing the probability of miscalculations.
These elements create a high-risk environment where a single incident—a mine strike, a drone attack, or an accidental exchange of fire—could trigger a rapid escalation.
Market Reaction: Crude Oil Price Dynamics
Immediate Price Surge
As tensions have risen, Brent crude futures have traded in a wide range, reflecting heightened uncertainty. On days when headlines break about Iranian threats or U.S. retaliatory measures, prices have jumped by 3-5% within hours. For example, when Iran’s Revolutionary Guard Corps (IRGC) announced war games in the strait in early Q3 2025, Brent rose from $85 to $92 per barrel in a single session. This volatility is not just about supply fears—it also reflects speculative positioning and algorithmic trading amplifying moves.
Supply-Side Concerns and Inventory Levels
Complicating the picture is the current state of global inventories. According to the International Energy Agency (IEA), OECD commercial stocks are below the five-year average, providing a thinner safety buffer. When combined with low spare capacity in OPEC+ nations (primarily Saudi Arabia and the UAE), any disruption in the Hormuz region will have outsized effects. Key figures:
| Metric | Current Value | Historical Context |
|---|---|---|
| OECD crude stocks | 2.7 billion barrels | -8% vs 5-year avg |
| OPEC+ spare capacity | ~4 million bpd | Down from 6 million in 2022 |
| Iranian export capacity | ~1.5 million bpd | Under sanctions since 2018 |
Low inventories mean that even a temporary disruption of two weeks could deplete emergency stocks and lead to rationing in some import-dependent countries.
Price Volatility: A Two-Way Risk
While the primary fear is of upward price spikes, volatility also works in the opposite direction. If diplomatic breakthroughs occur—such as a temporary agreement to de-escalate—prices can crash just as quickly. In 2019, after the drone attack on Saudi Aramco’s Abqaiq facility, crude surged 15% in one day but then retraced half those gains within a week as supply returned. This pattern of "buy the rumor, sell the fact" is characteristic of geopolitical risk premiums. Investors should be prepared for sharp reversals.
Broader Market Impact: Beyond Crude
Energy Equities and Sector Rotation
The energy sector, particularly oil majors like ExxonMobil, Shell, and Chevron, has seen increased trading volume and share price gains. However, this is not a straightforward bull case for all energy stocks. Refiners and downstream players may face margin compression if crude spikes faster than product prices. Conversely, integrated companies with upstream exposure benefit directly. For example, during the March 2025 tensions, Chevron’s stock rose 4% in one week, while Phillips 66 fell 2% due to higher input costs.
Currency and Commodity Correlations
Geopolitical risk in the Strait of Hormuz has predictable effects on currencies and other commodities:
- U.S. Dollar: Often strengthens as a safe-haven, but a spike in oil prices can weigh on the currency due to higher import costs.
- Gold: Rises in times of stress, but may take a back seat if oil dominates headlines.
- Shipping costs: Freight rates for Very Large Crude Carriers (VLCCs) have doubled in the past month due to higher war risk premiums.
- Natural gas: While less directly linked, LNG shipments from Qatar and the UAE also transit the strait, affecting European and Asian gas prices.
Sentiment and Risk Aversion
The broader equity market has shown signs of risk-off behavior, with defensive sectors (utilities, healthcare, and consumer staples) outperforming cyclicals. The CBOE Volatility Index (VIX) has risen by 10 points over the past two weeks, reflecting increased fear. Bond yields have fallen as investors rotate into treasuries, while emerging market equities—particularly those in oil-importing nations like India and Turkey—have suffered.
Practical Examples and Scenarios
Scenario 1: Limited Disruption (High Probability, Low Impact)
A minor incident—such as a temporary mine closure or a brief naval confrontation—disrupts traffic for less than 48 hours. Oil prices spike 5-8% but quickly revert as supply resumes. Market volatility lasts for one to two weeks. This is the most likely outcome, given that both Iran and the U.S. have incentives to avoid a full-blown conflict. However, the risk of miscommunication remains.
Impact: - Brent crude rises to $95-100, then settles back to $85-90. - Energy stocks gain 2-4%. - Broader market corrects 1-2%, then recovers.
Scenario 2: Prolonged Disruption (Medium Probability, Severe Impact)
A significant attack on tankers or naval vessels forces the strait to close for 10-14 days. Global supply is cut by 15-20%. Countries dip into strategic petroleum reserves (SPR). Oil prices surge to $130-150 per barrel. Inflation fears spike, central banks may pause or reverse rate cuts.
Impact: - Brent crude sees a sustained rally above $120. - Energy sector outperforms, with integrated majors up 10-15%. - Cyclical stocks, airlines, and industrials fall sharply. - Bond yields rise initially due to inflation fears, then fall as recession concerns mount.
Scenario 3: Full Conflict (Low Probability, Systemic Crisis)
Iranian or U.S. military action escalates into a regional war, including attacks on infrastructure across the Middle East. The strait is blocked indefinitely. Crude prices hit $180-200. Global recession becomes highly likely. Central banks may implement emergency measures.
Impact: - Brent crude at $180+ within weeks. - Energy sector surges, but this is a "buy on the way up, sell before the top" scenario. - Equities collapse 20-30% globally. - Safe havens (gold, USD, Swiss franc) explode higher.
Practical Takeaway: For most investors, Scenario 2 is the base case for hedging strategies. Scenario 1 should be treated as noise.
Strategies for Navigating Volatility
For Traders: Tactical Positioning
- Use options: Buying out-of-the-money call options on Brent or energy ETFs (like XLE) provides leveraged exposure to spikes while capping downside.
- Spread trading: Consider calendar spreads (e.g., buying near-term futures, selling later-dated) to capture backwardation, which often deepens during geopolitical crises.
- Stop-loss discipline: Given the two-way risk, set tight stops on long positions. A diplomatic headline can reverse gains in minutes.
For Investors: Long-Term Portfolio Adjustments
- Increase energy exposure: Overweight integrated oil majors and midstream MLPs (Master Limited Partnerships), which benefit from higher prices and stable cash flows.
- Diversify with safe havens: Add to gold (via ETFs like GLD) and long-duration treasuries to hedge against tail risk.
- Reduce cyclical exposure: Trim positions in airlines, cruise lines, and consumer discretionary stocks that are vulnerable to higher fuel costs.
For Policy Makers and Corporates: Risk Management
- Build strategic reserves: Governments should accelerate SPR purchases during dips to prepare for disruption.
- Diversify supply sources: For importing nations, ramping up domestic production or securing contracts with alternative exporters (e.g., in the Americas) reduces reliance on Hormuz.
- Hedge fuel costs: Airlines and logistics companies should lock in fuel prices via swaps or options for the next 6-12 months.
Conclusion: Key Takeaways
The Strait of Hormuz remains the single most important geopolitical variable for global energy markets. Rising tensions with Iran, the specter of military conflict, and fragile supply-demand balances create a cocktail of volatility that traders and investors must respect. While the base case scenario involves limited disruption, the tail risks of prolonged closure or outright war cannot be ignored.
Key Takeaways:
- Prices are driven by perception as much as reality: News headlines and military maneuvers move markets more than actual supply disruptions.
- Volatility is a two-way street: Be prepared for both surges and crashes. Use options and stop-losses to manage risk.
- Diversify your exposure: Do not put all your eggs in the energy basket; safe havens and defensive sectors provide balance.
- Stay informed but avoid panic: Monitor credible sources like the IEA, EIA, and official U.S. or EU statements. Ignore speculative social media posts.
- Scenario plan: Map out your response to each of the three scenarios above. Having a plan reduces reactive decisions.
In a world of rising geopolitical risk, the Strait of Hormuz will continue to be a source of market anxiety. By understanding the dynamics, preparing for multiple outcomes, and maintaining a disciplined approach, you can navigate these turbulent waters with confidence.
Disclaimer: This blog post is for informational purposes only and does not constitute investment advice. Always consult with a qualified financial advisor before making any trading or investment decisions.


Comments
Post a Comment